Investors have many tools to choose from when they want to learn about stocks, but what if you also wanted a way to visualize your portfolio in beautiful charts and graphs to make it more understandable? We examine three portfolio visualizers and analytics tools that help investors gain better insights into their portfolios. These tools will help you research stocks, conduct portfolio analysis and visualize your investment portfolio, providing additional insights your brokerage tools may miss.
Investing can feel overwhelming, especially when you have multiple investments across asset classes and accounts. You may have a preferred plan or asset mix you want to reach in your portfolio, but you need an easy way to analyze your progress to avoid building manual Excel sheets and tracking things by hand.
That’s where portfolio visualizers come in. These insightful tools provide a fantastic complement of information to add to your brokerage tool. Reviewing your investments, helping you identify the strengths and weaknesses of your portfolio, and ultimately guiding you toward greater profitability.
Whether you’re a beginner or an experienced investor, these portfolio visualizers cater to all skill levels. From tracking performance to simulating and stress-testing your portfolio, they offer a wide range of features to assist you in making data-driven investment decisions.
Don’t let confusion and uncertainty hinder your investment journey. With the right portfolio visualizer, you can optimize your investments, minimize risk, and achieve your financial goals. So, let’s dive in and discover the top portfolio visualizer tools that will help you unlock your investment potential in Canada.
Why Canadians Should Use Portfolio Visualizer Tools
Table of Contents
ToggleInvestment platforms don’t always provide the in-depth analytical tools investors need to truly understand their investments. Portfolio visualizer tools are essential for Canadian investors who want to take charge of their investment journey. These tools offer many benefits that can significantly enhance your investment strategy.
Firstly, portfolio visualizers provide a comprehensive view of your investments. They consolidate all your investment data, giving you a holistic picture of your portfolio’s performance. Having all the information in one place lets you quickly identify areas requiring attention and make necessary adjustments.
Secondly, portfolio visualizers help you analyze the risk and return of your investments. They provide detailed insights into the performance of individual assets, asset classes, and the overall portfolio. We may be unaware of how much weight specific stocks have in our portfolio or what percentage of our total portfolio a specific sector represents. With this additional information provided by portfolio analytics, you can make more informed decisions regarding rebalancing, diversification, and asset allocation.
Additionally, some portfolio visualizers enable you to stress-test your portfolio. By simulating different market scenarios, you can assess how your investments would perform under various conditions. You could also create sample or simulated portfolios and watch lists to test out investment hypotheses. This feature is particularly valuable during market volatility when you need to evaluate the resilience of your portfolio.
Lastly, portfolio visualizers offer tracking capabilities that allow you to monitor your investments in real time. You can track the performance of your portfolio against benchmarks, set up alerts for price changes, and receive customized reports to help you stay informed and in control.
Three Top Portfolio Visualizer Tools for Canadians
Now that we understand the benefits of portfolio visualizer tools and the key features to look for, let’s explore the top portfolio visualizer tools specifically designed for Canadian investors:

Portfolio Visualizer 1: Stock Unlock
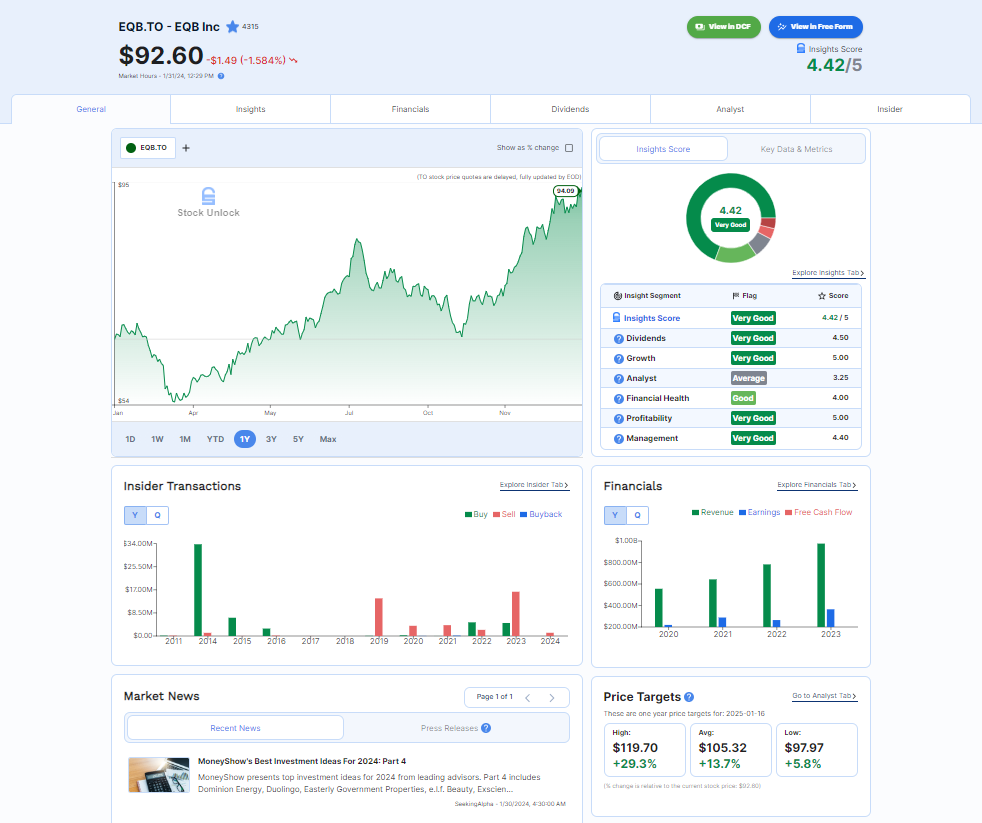
Stock Unlock is a powerful portfolio visualizer tool designed for individual stock investors. I first came across it when writing an article on Canadian Personal Finance Youtubers, as one of the co-owner’s has a great YouTube channel as well. It offers a user-friendly interface with a portfolio dashboard that lets you track and analyze your investments easily. The homepage lets you view your portfolio, market data, watchlists and more from a single dashboard. The tool includes stock research and portfolio visualization tools to help investors make smarter decisions.
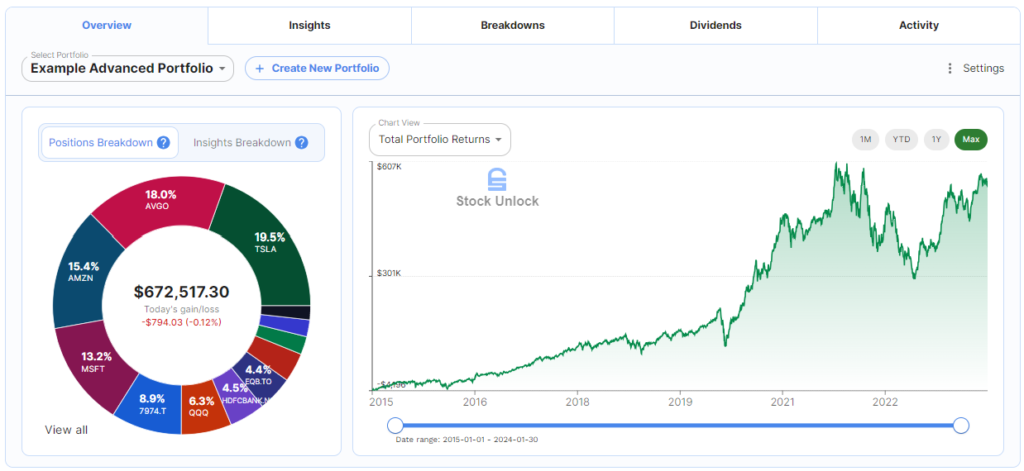
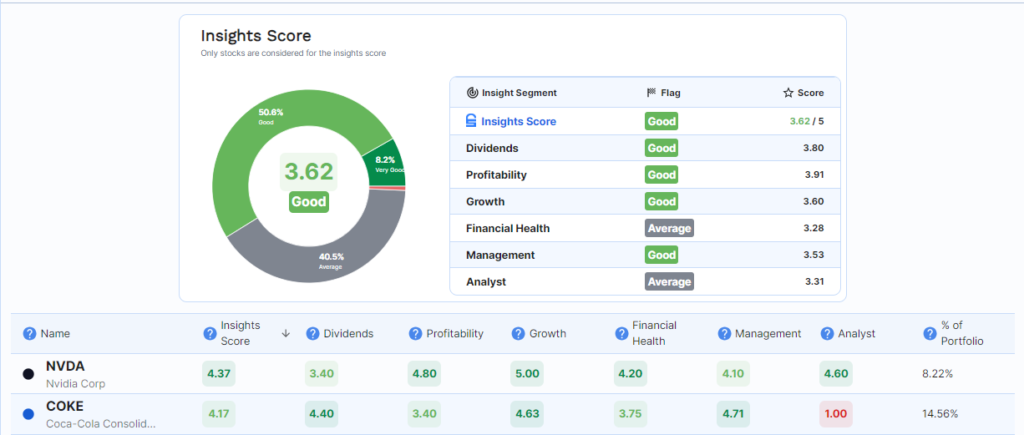
The Portfolio section lets you connect your brokerage with Stock Unlock or build it manually. The Portfolio page of Stock Unlock gives you the option to view your accounts separately or as a single combined portfolio, with each option providing different insights into your investment mix. With comprehensive performance analysis and risk assessment features, Stock Unlock provides valuable insights to optimize your portfolio.
They provide detailed breakdowns of how your portfolio stacks up across Asset Classes, Industries, Countries, Asset Types, Currency, and Market Cap—further helping investors tweak their approach with portfolio visualizer tools that help them understand their holdings. These advanced asset allocation tools enable you to analyze and rebalance your portfolio based on your investment goals and risk tolerance.
The Dividends tab breaks down a month-by-month chart of expected distributions and projected income by month, industry, country, and holding. For dividend-focused investors, seeing the detailed projections and breakdowns is a big bonus.
Stock Unlock also provides users with awesome stock research to help investors make better investing decisions. With many prebuilt filters and selected preset lists of stocks, users can narrow their search for their next investment using the stock research tool. Users can also select important metrics and select or deselect options to show in the table.
When researching a specific stock of interest, Stock Unlock gathers everything you need to know to make an informed decision including insider transaction details of who is buying and selling the stocks. You can also compare stocks side by side or create graphs of certain data points comparing multiple stocks all at once using any of the data found in the companies’ financial statements.
One element of this tool I love is “Learn” mode. “Learn” is a toggle switch at the top of the platform that allows even new investors to utilize the full benefits of the tool by providing pop-up tooltips next to almost any element of the data included to ensure no user is ever lost or confused. Kudos to the Stock Unlock team for making it extremely user-friendly for newbies and experienced investors alike.
Stock Unlock Brokerage Connections
Stock Unlock integrates with major Canadian and American financial institutions and brokers, ensuring seamless data synchronization.
Stock Unlock offers a user-friendly interface, advanced analytics, and in-depth stock research. It is suited for both beginner and advanced investors and helps them improve their investing.
Stock Unlock Cost
You can explore some of the functionality of the platform for free; however, the price for Stock Unlock is very reasonable,
- $7.50 USD/month if you sign up for annual plan ($89.99)
- $8.99 USD/Month for a Monthly plan (108.88)
Who Stock Unlock is Best for
Investors interested in individual stocks who want to conduct stock research to learn more about the fundamentals of the companies they are investing in and also want visually appealing analytics for their portfolios.
Portfolio Visualizer 2: Blossom Social Investing App
The Blossom Social Investing App is another great option which provides users with portfolio visualization tools and stock research tailored toward DIY investors.
Blossom Social recently broke records with a community funding round raising close to 1 million breaking Canadian records in Crowdfunding. I myself am now a shareholder in Blossom!
It is a mobile-only social platform where investors can connect and discuss trades, stocks, and investing approaches. It also provides additional analytics by connecting your brokerage account. See our full review of Blossom Social here.
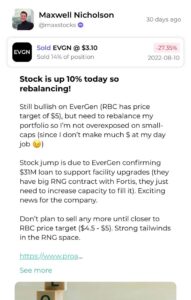
Blossom Social allows users to link their brokerage portfolios to the platform, providing additional portfolio analytics unavailable with some brokerages. Users also have the option to share their portfolio and trade activities with the Blossom community. They are prompted to share their rationales for those actions, which can launch insightful discussions on stocks and strategies among users.
Blossom allows users to monitor the markets by tracking stocks on a watch list, reviewing earnings calendars, receiving daily market updates, and getting a regular newsletter on market happenings.
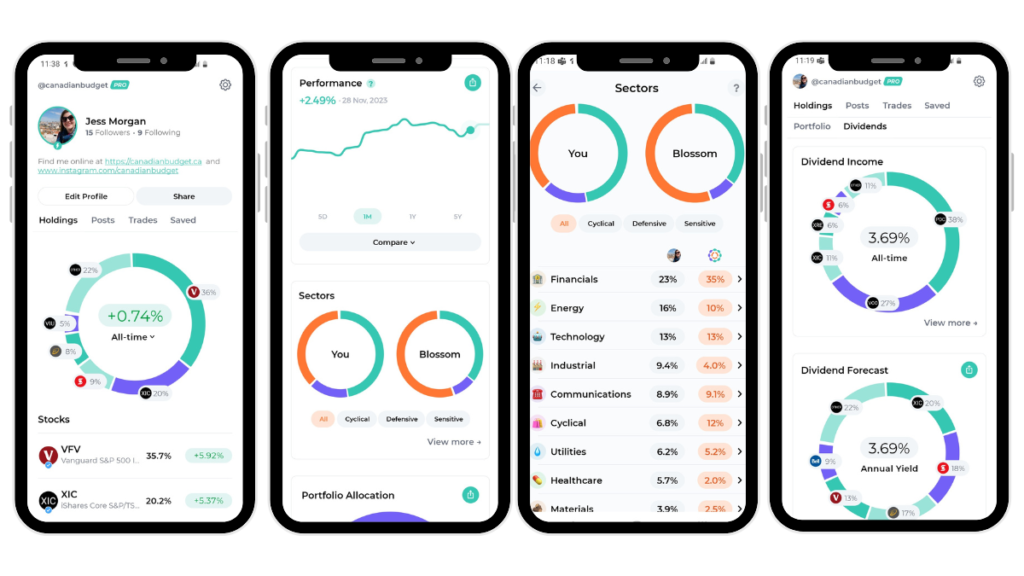
Blossom Social gives users portfolio analytics that helps them make sense of their holdings. Users can view individual accounts or a combined overall portfolio that breaks down their portfolio by holdings.
Users can create portfolios and dividend goals to track their progress. Review portfolio performance, review sector breakdown, and compare their portfolio sector mix to the Blossom community. A breakdown of stock countries and ETF region exposure and portfolio allocation between ETF and Stocks is available.
Users can set a dividend goal, track monthly dividends and dividend income broken out by dividend payer, forecast the dividends and show dividend allocation indicating which % of their portfolio holdings issue dividends.
Blossom Social Investing Brokerage Connections:
In Canada, Blossom can import data from Wealthsimple and Questrade DIY portfolios, and recently launched in the US with connections to Robinhood, Webull, Charles Schwab, Fidelity, Etrade and Vanguard accounts. Users also have the option to add investments manually if their brokerage is not connected or they prefer to utilize the features without connecting their portfolios. Integration with several financial institutions and brokers ensures accurate and up-to-date data.
Blossom Social Investing App Cost
The Blossom Social Investing app is free, but they have a paid option called Blossom Pro that provides access to these full portfolio analytics. The Blossom Pro cost is $59.99 CAD annually as of Feb 2024.
Who Blossom Social Investing App is Best For
Users who want more insights into their portfolio makeup and want to improve their stock market awareness but don’t need in-depth research capabilities. Also best for users who want a social experience and are interested in talking about investing with others.
Portfolio Visualizer 3: Snowball Analytics
Snowball is based in the EU, but has the ability to connect to your Canadian Brokerage accounts. Snowball is a powerful portfolio visualizer and portfolio tracker that provides a clean and beautiful user experience, allowing you to track your portfolios and dividend goals.
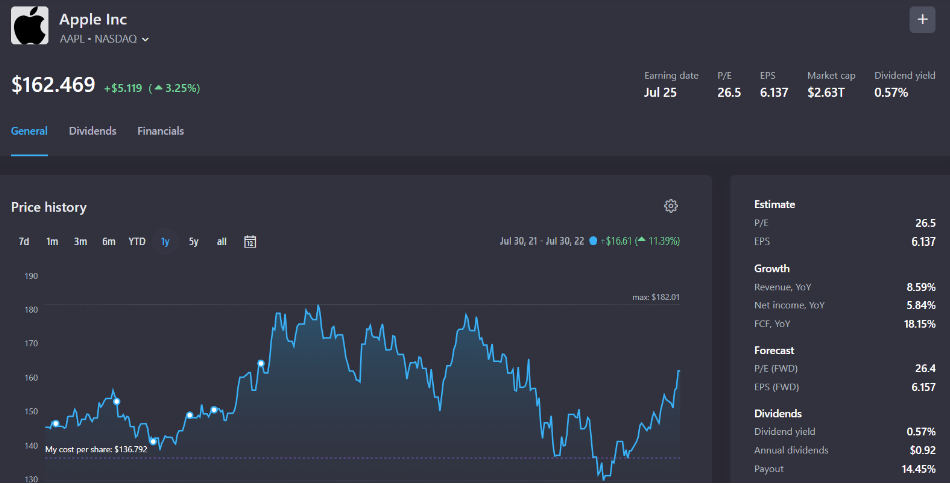
I think Snowball focuses more on portfolio visualization than stock research and is specifically helpful for investors interested in dividends. It offers some stock research tools so you can learn more about the individual stocks you are interested in. But doesn’t go into as deep an analysis as Stock Unlock does.
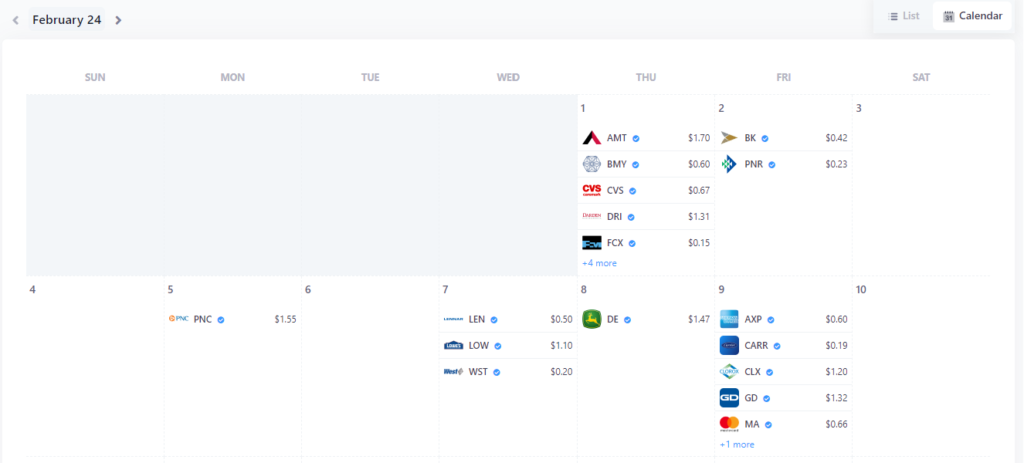
You can create a dividend calendar, which is a neat feature I haven’t seen before that lets you map out when the dividends of your holdings are paid out.
Snowball Analytics Brokerage Connections
Snowball connects with over 1000 brokerages worldwide and tracks over 70 exchanges. Chances are, your brokerage is probably included.
Snowball Analytics Cost
Snowball offers four levels of pricing and features.
- FREE – 1 portfolio + 10 holdings
- Starter – 1 Portfolio + Unlimited Holdings & Brokerage Linking + More($6.70 USD/ Month $79.99/Annually)
- Investor – 10 Portfolios – Unlimited Holdings + more ($12.50 USD/ Month $149.99/Annually)
- Expert – Unlimited Portfolios, Unlimited holdings + More ($20.80 USD/ Month $249.99/Annually)
Who Snowball Analytics is Best for
Dividend investors who want a better way to track and plan for their dividend investing and Dividend income and visualize their portfolios in a clean and appealing way.
The Bottom Line
Our brokerages don’t always give us all the tools we need to make informed decisions and track our performance. These tools can add analytics, insights, research and community connections brokerages simply cannot provide. These free or low cost tools add great insights to help us become better investors!
About The Author
Jessica Morgan
Jessica Morgan is the founder and CEO of Canadianbudget.ca. She is passionate about personal finance and helping Canadians improve their financial literacy by providing more Canadian focused financial content. A millennial mom of one, she has a burning obsession with all things personal finance.
Jessica has a BA in East Asian Studies from York University and a Masters in Business Administration from Toronto Metropolitan University. She is a career public sector employee with a Hybrid Pension, and an advocate for Canadian women to improve their personal finance knowledge.


